Building a Scalable Postgres Metrics Backend using the Citus Extension
(Copy of original publication)
From nearly the beginning of the Citus Cloud service, we’ve had an internal formation provisioned and managed by the service itself. Dogfooding in this manner brings all the usual benefits such as gaining operational knowledge, customer empathy, and etc.
However, more interesting than yet another blog post going over the importance of dogfooding is the two different ways we’re using our Citus formation. Setting up a distributed table requires a bit more forethought than a normal Postgres table, because the choice of shard column has a big impact on the types of queries and joins you can do with the data.
We’re going to look at two cases here: a time-series metrics table and an events table.
Time-Series Metrics
The first is a metrics table that we fill with data from AWS Cloud Watch
for all servers and volumes that we manage. We then show graphs of this
both for internal and customer-facing dashboards. The table has the
following structure and is sharded on server_id. The primary key is
several columns wide to both serve as a unique constraint preventing
duplicate data points and as an index over all the columns we query on.
                  Table "public.cw_metrics"
    Column    |           Type           |     Modifiers
--------------+--------------------------+--------------------
 server_id    | uuid                     | not null
 aws_id       | text                     | collate C not null
 name         | text                     | collate C not null
 timestamp    | timestamp with time zone | not null
 sample_count | bigint                   | not null
 average      | double precision         | not null
 sum          | double precision         | not null
 minimum      | double precision         | not null
 maximum      | double precision         | not null
 unit         | text                     | collate C not null
Indexes:
    "cw_metrics_pkey" PRIMARY KEY, btree (server_id, "timestamp", aws_id, name)
Some sample rows:
citus=> select * from cw_metrics order by timestamp desc limit 2;
-[ RECORD 1 ]+-------------------------------------
server_id    | f2239a4b-7297-4b66-b9e3-851291760b70
aws_id       | i-723a927805464ac8b
name         | NetworkOut
timestamp    | 2016-07-28 14:13:00-07
sample_count | 5
average      | 127505
sum          | 637525
minimum      | 111888
maximum      | 144385
unit         | Bytes
-[ RECORD 2 ]+-------------------------------------
server_id    | f2239a4b-7297-4b66-b9e3-851291760b70
aws_id       | i-723a927805464ac8b
name         | NetworkIn
timestamp    | 2016-07-28 14:13:00-07
sample_count | 5
average      | 32930.8
sum          | 164654
minimum      | 18771
maximum      | 46584
unit         | Bytes
There are currently only two queries on this table. The first is simply inserting data after periodically fetching data from AWS CloudWatch.
The other gets the data for the graphs that are shown both on the
internal admin site and on the customer-facing console and looks like
select … where server_id in (?,) and name in (?,) and timestamp > now()-'? hours'::interval.
Because Citus shards are just normal postgres tables, this query is
parallelized by going to only the shards necessary for the server_id
list. Once on each shard, finding the data is very fast because the
other two where conditions are covered by the primary key.
The main downside to sharding on server_id is expiring old data is a
little cumbersome. We have to go to each shard and run a
delete … where timestamp > '?'. This can take a while depending on
how big a window we’re pruning, and it leaves a bloated table that
requires vacuuming. A nice alternative is to use standard time-based
table partitioning for each of the shards, and then simply drop the old
time tables. We haven’t done this yet because expiry hasn’t been a
problem so far, but it’s nice the option is there.
Events
The other table is a general event table. We are using a hosted exception tracker to discover problems in production. However we were also sending that service unexceptional exceptions. That is, these were expected errors, such as the failure to ssh into a server that was still booting. Sometimes an increased rate of exceptions in a particular category can indicate a problem even though a normal baseline rate is okay.
However the exception tracker was not the right place for this. It made it harder than necessary to spot real errors, so we moved these events to a distributed Citus table which looks like this:
               Table "public.events"
   Column   |           Type           | Modifiers
------------+--------------------------+-----------
 id         | uuid                     | not null
 name       | text                     | not null
 created_at | timestamp with time zone | not null
 data       | jsonb                    |
Indexes:
    "events_pkey" PRIMARY KEY, btree (id)
    "events_created_at_idx" brin (created_at)
    "events_data_idx" gin (data jsonb_path_ops)
    "events_name_idx" btree (name)
The id column is a randomly generated uuid and the shard key, which
gives a roughly equal distribution amongst the shards as events come in.
Also because Citus is just an extension on top of Postgres, we’re able
to take advantage of the powerful jsonb data type with the
corresponding gin index which gives us very fast lookups on arbitrary
keys, and the new brin index type.
Here are some example rows from the events table:
citus=> select * from events order by created_at desc limit 2;
-[ RECORD 1 ]-
id         | 9a3dfdbd-c395-40bb-8d25-45ee7c913662
name       | Timeout::Error
created_at | 2016-07-28 13:18:47.289917-07
data       | {"id": "5747a999-9768-429c-b13c-c7c0947dd950", "class": "Server", "message": "execution expired"}
-[ RECORD 2 ]-
id         | ba9d6a13-0832-47fb-a849-02f1362c9019
name       | Sequel::DatabaseConnectionError
created_at | 2016-07-28 12:58:40.506267-07
data       | {"id": "232835ec-31a1-44d0-ae5b-edafb2cf6978", "class": "Timeline", "message": "PG::ConnectionBad: could not connect to server: Connection refused\n\tIs the server running on host \"ec2-52-207-18-20.compute-1.amazonaws.com\" (52.207.18.20) and accepting\n\tTCP/IP connections on port 5432?\n"}
This data is currently mostly used to show graphs on the admin dashboard to spot outliers. The query to gather data is for the graphs is
SELECT count(*), name, date_trunc('hour', created_at) as hour
FROM events
WHERE created_at > now()-'1 week'::interval
GROUP BY name, hour;
And the graphs look like
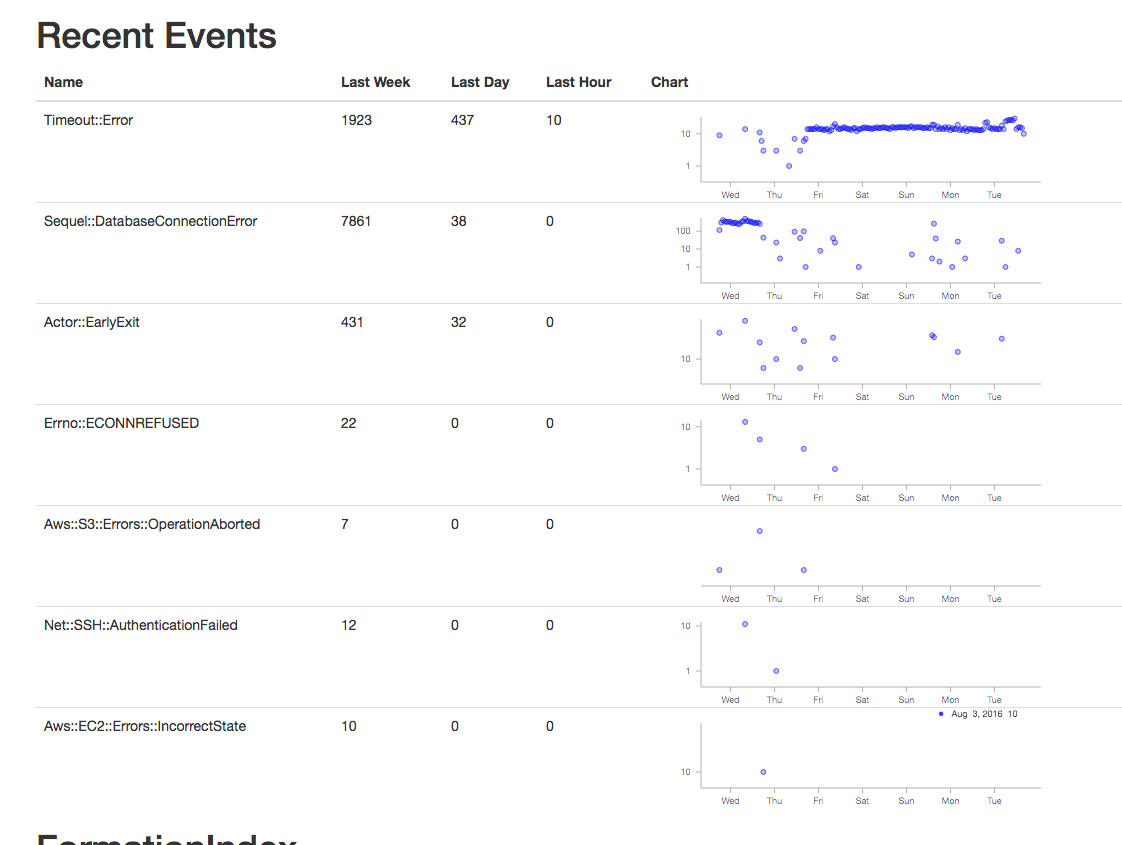
This clearly shows a time period of something not quite right. Sometimes we’ve gone into psql to look at the jsonb to get details if there is a high rate of some particular error to figure out which server is causing it. That is currently a manual process, and perhaps sample json bodies could be put into the UI, but doing the work for that hasn’t been worth it yet.
A more exciting project would be to use some machine learning on past time periods to automatically detect outliers. If we ever do that, I’ll be sure to put a writeup on the experience on this blog.