Monitoring
Logging
What Is Logged
By default, Citus Cloud logs all errors and other useful information that happen on any of the Citus instances and makes it available to you.
The logs will contain the following messages:
- Citus and PostgreSQL errors
- Slow queries that take longer than 30 seconds
- Checkpoint statistics
- Temporary files that are written and bigger than 64 MB
- Autovacuum that takes more than 30 seconds
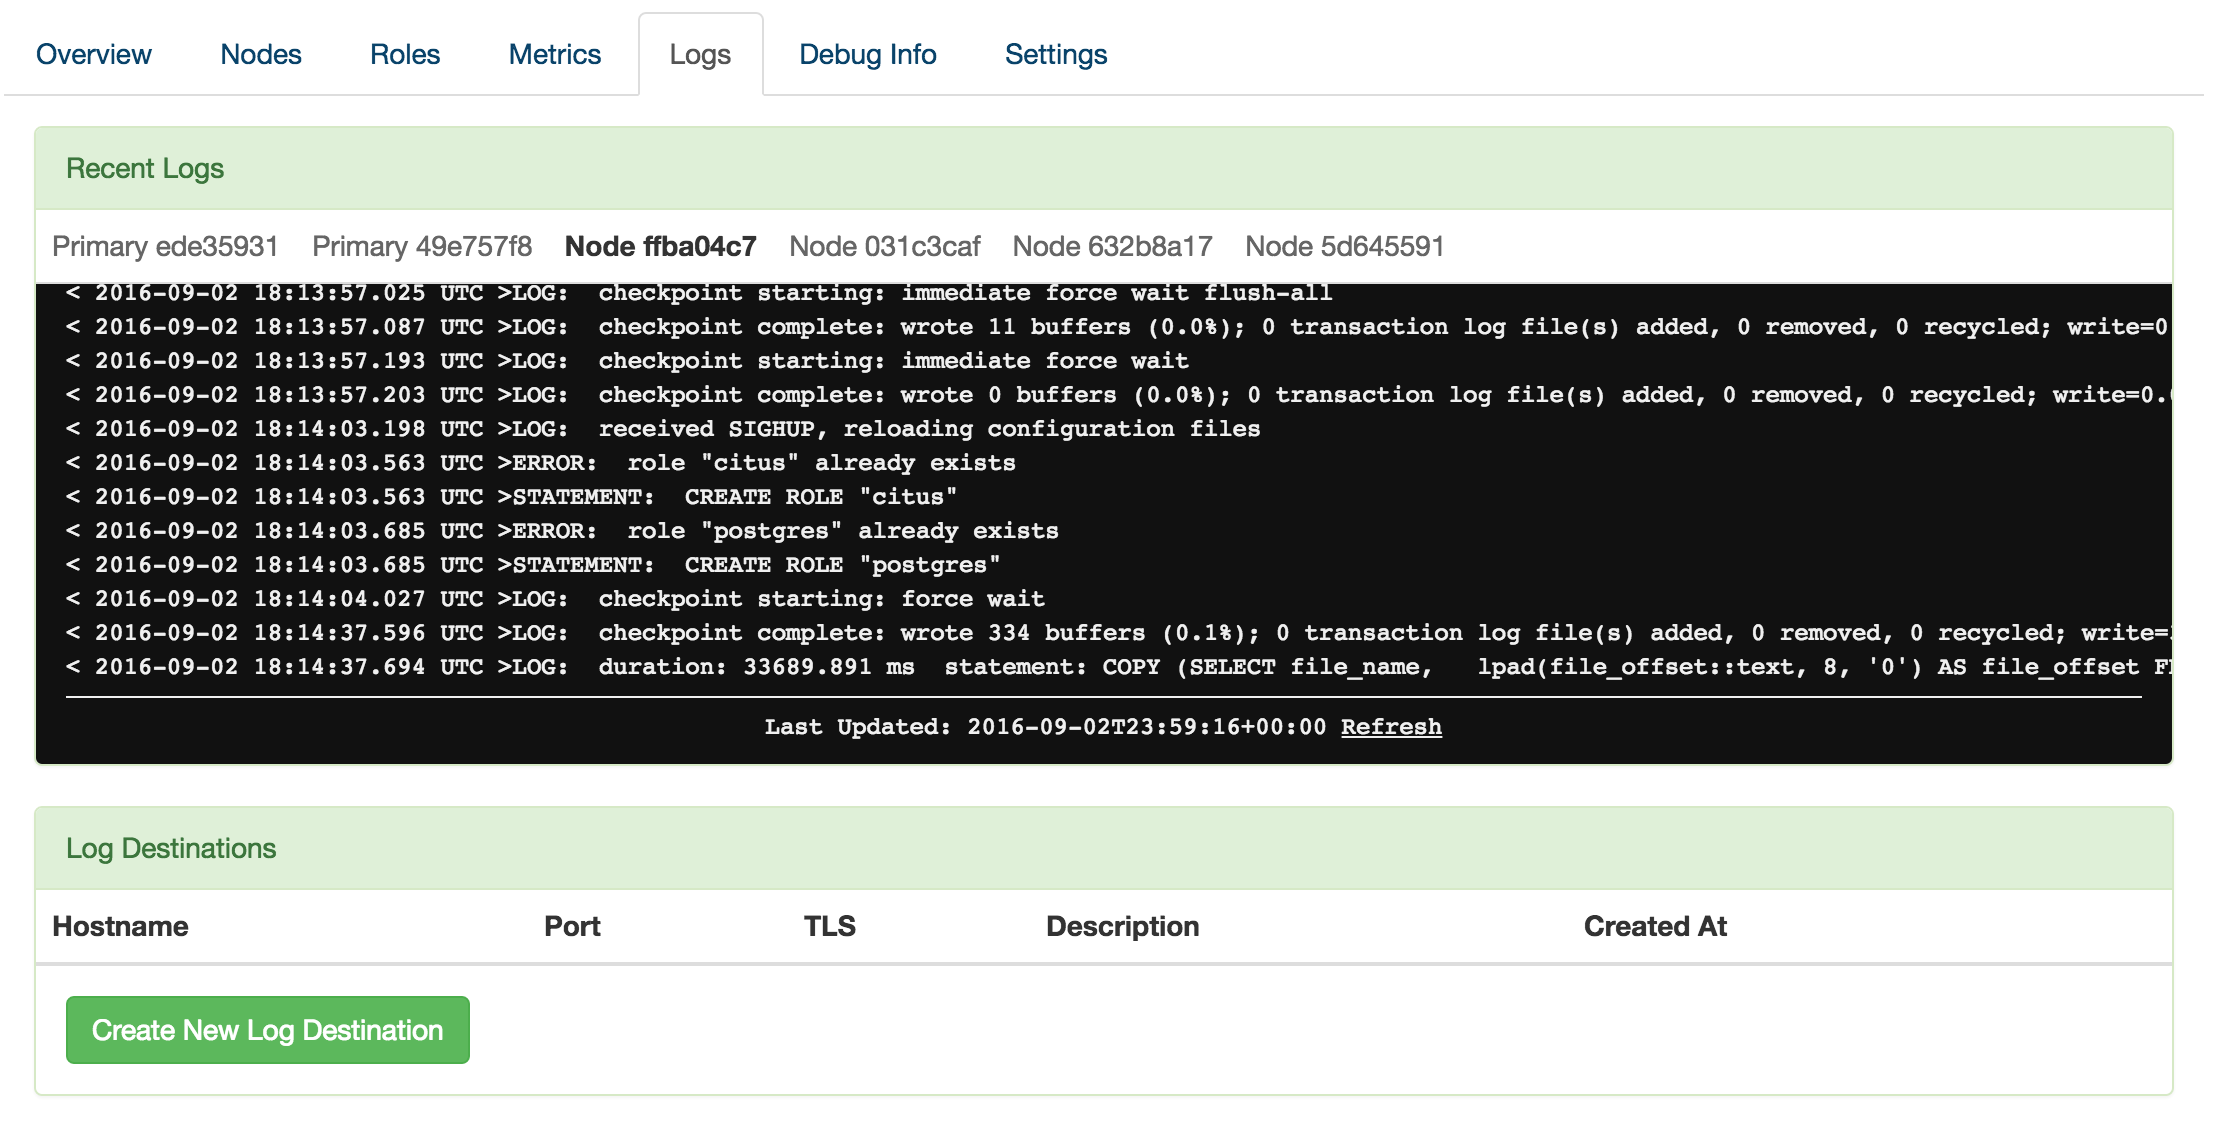
Recent Logs
The Citus Cloud dashboard automatically shows you the most recent 100 log lines from each of your servers. You don’t need to configure anything to access this information.
External Log Destinations
For anything more than a quick look at your logs, we recommend setting up an external provider. Through this method the logs will transmit to a dedicated logging service and you can analyze and retain them according to your own preferences. To use an external provider, create a new logging destination in the Citus Cloud console. For instance, here is the new destination dialog filled in with Papertrail settings:
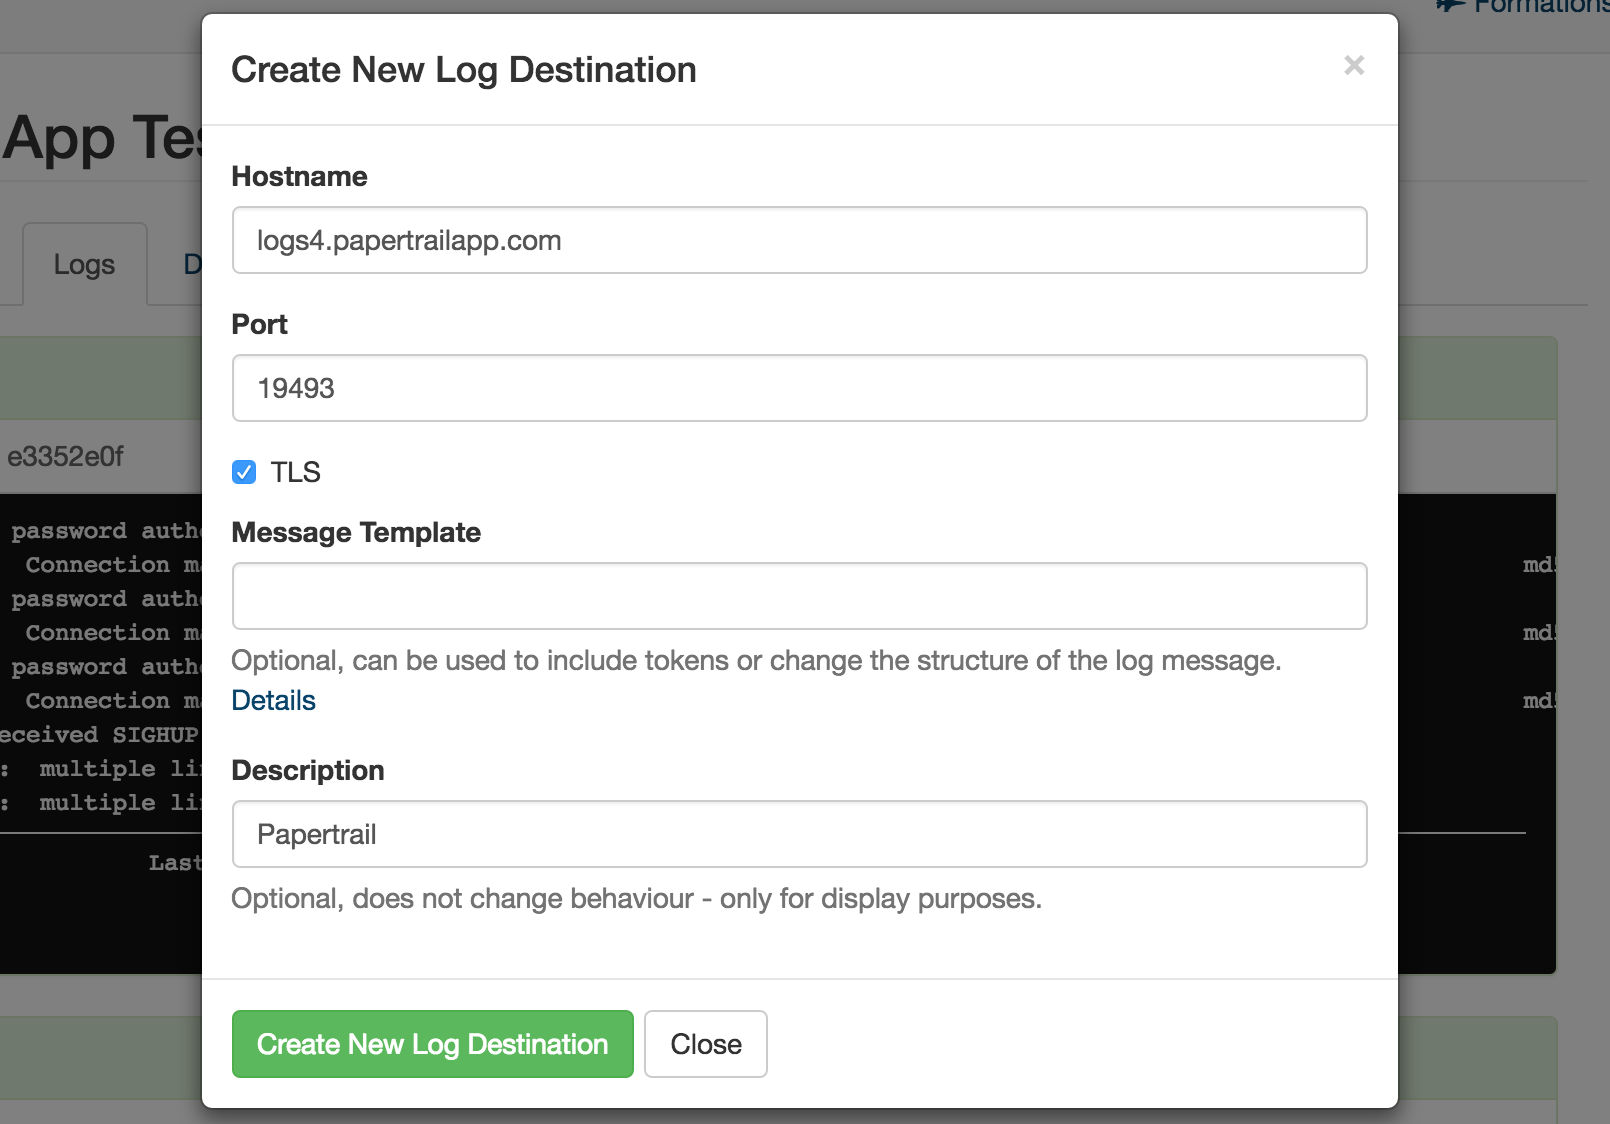
Note that after creation, it might take up to five minutes for logging preferences to be applied. You’ll then see logs show up in your chosen provider’s dashboard.
The settings to use differ per provider. In the following tables we list settings verified to work for a number of popular providers.
Verified Provider Settings
Replace <token> with the custom token listed in the provider’s web site. This token tells them the logs are yours.
Papertrail
| Hostname | logs4.papertrailapp.com |
| Port | 19493 |
| TLS | Yes |
| Protocol | IETF Syslog |
| Message Template |
Loggly
| Hostname | logs-01.loggly.com |
| Port | 514 |
| TLS | No |
| Protocol | BSD Syslog over TCP |
| Message Template | <${PRI}>1 ${ISODATE} ${HOST} ${PROGRAM} ${PID} ${MSGID} [<token>@41058 tag=\”CITUS\” ] $MSG\n |
Sumologic
| Hostname | syslog.collection.us2.sumologic.com |
| Port | 6514 |
| TLS | Yes |
| Protocol | IETF Syslog |
| Message Template | <${PRI}>1 ${ISODATE} ${HOST} ${PROGRAM} ${PID} ${MSGID} [<token>@41123] $MSG\n |
Logentries
| Hostname | data.logentries.com |
| Port | 80 |
| TLS | No |
| Protocol | IETF Syslog |
| Message Template | <token> $ISODATE $HOST $MSG\n |
Other
We support other providers that can receive syslog via the BSD or IETF protocols. Internally Citus Cloud uses syslog-ng, so check your providers configuration documentation for syslog-ng settings.
Please reach out if you encounter any issues.
RSS Event Feed
To monitor events in the life of a formation with outside tools via a standard format, we offer RSS feeds per organization. You can use a feed reader or RSS Slack integration (e.g. on an #ops channel) to keep up to date.
On the upper right of the “Formations” list in the Cloud console, follow the “Formation Events” link to the RSS feed.
The feed includes entries for three types of events, each with the following details:
Server Unavailable
This is a notification of connectivity problems such as hardware failure.
- Formation name
- Formation url
- Server
Failover Scheduled
For planned upgrades, or when operating a formation without high availability that experiences a failure, this event will appear to indicate a future planned failover event.
- Formation name
- Formation url
- Leader
- Failover at
For planned failovers, “failover at” will usually match your maintenance window. Note that the failover might happen at this point or shortly thereafter, once a follower is available and has caught up to the primary database.
Failover
Failovers happen to address hardware failure, as mentioned, and also for other reasons such as performing system software upgrades, or transferring data to a server with better hardware.
- Formation name
- Formation url
- Leader
- Situation
- Follower