Monitoring
Resources Usage
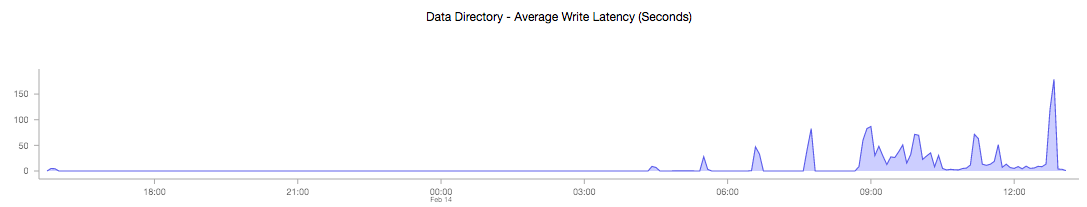
Citus Cloud metrics enable you to get information about your cluster’s health and performance. The “Metrics” tab of the Cloud Console provides graphs for a number of measurements, all viewable per node.
Amazon EBS Volume Metrics
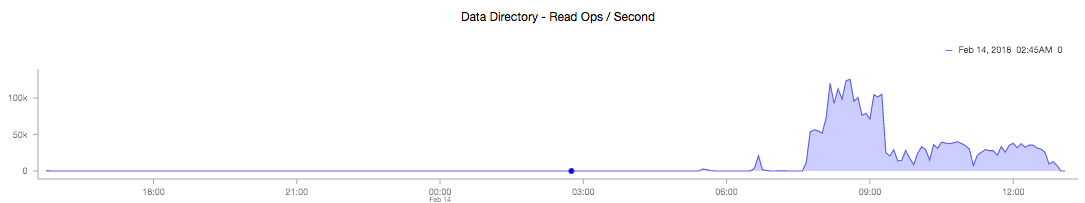
- Read IOPS. The average number of read operations per second.
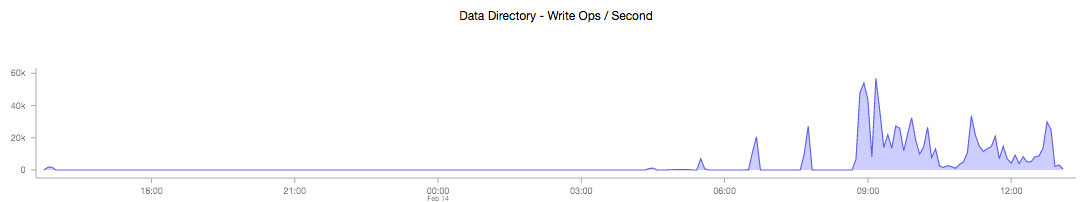
- Write IOPS. The average number of write operations per second.
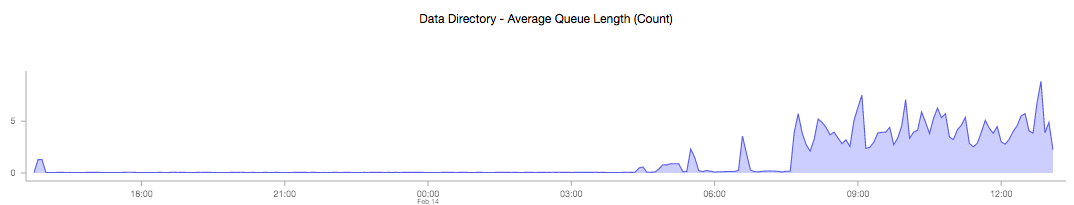
- Average Queue Length (Count). The number of read and write operation requests waiting to be completed.
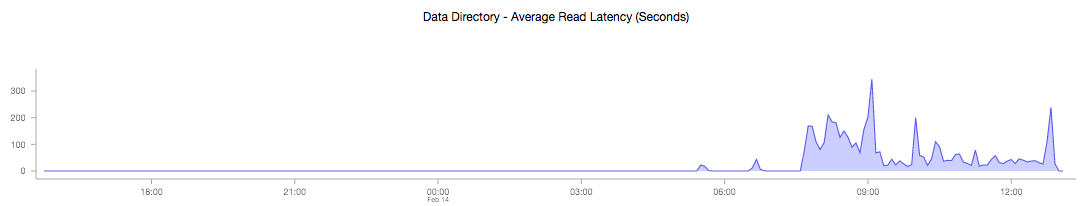
- Average Read Latency (Seconds)
- Average Write Latency (Seconds)
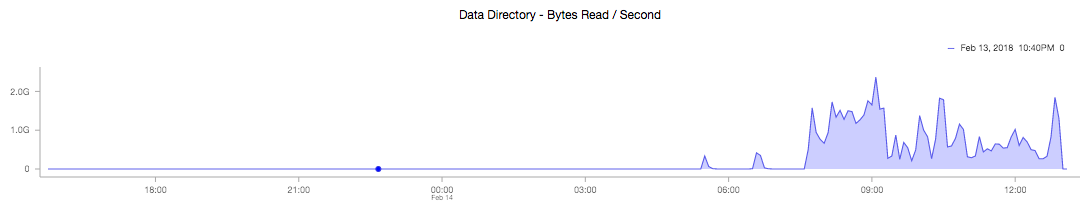
- Bytes Read / Second
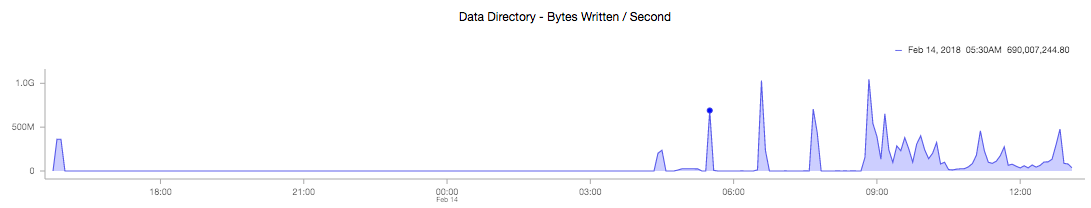
- Bytes Written / Second
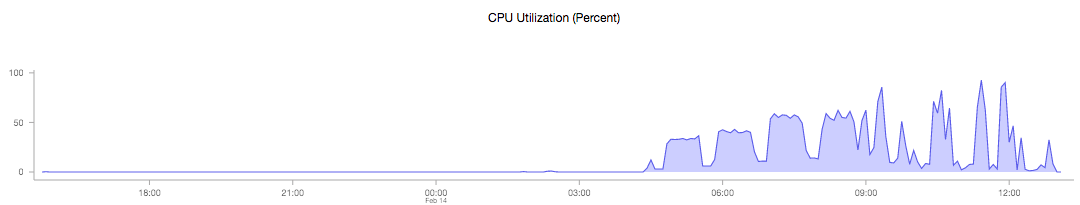
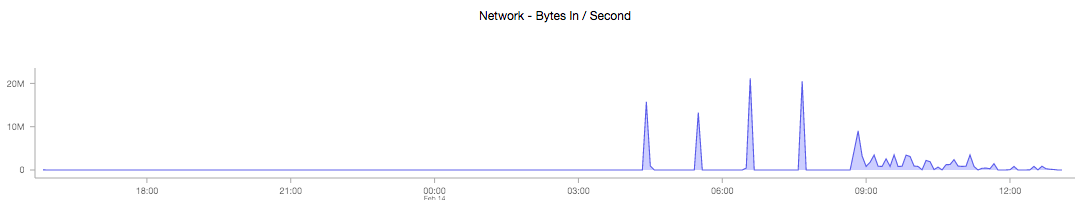
CPU and Network
- CPU Utilization (Percent)
- Network - Bytes In / Second
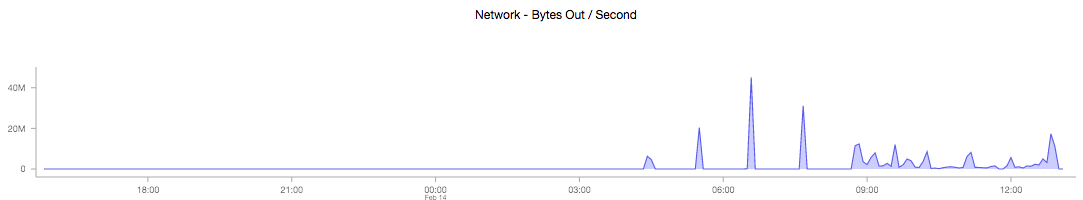
- Network - Bytes Out / Second
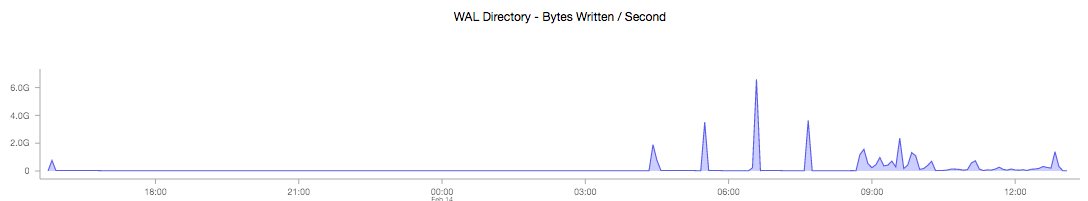
PostgreSQL Write-Ahead Log
- WAL Bytes Written / Second
Formation Events Feed
To monitor events in the life of a formation with outside tools via a standard format, we offer RSS feeds per organization. You can use a feed reader or RSS Slack integration (e.g. on an #ops channel) to keep up to date.
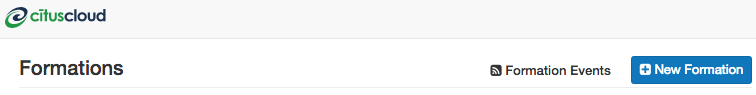
On the upper right of the “Formations” list in the Cloud console, follow the “Formation Events” link to the RSS feed.
The feed includes entries for three types of events, each with the following details:
Server Unavailable
This is a notification of connectivity problems such as hardware failure.
- Formation name
- Formation url
- Server
Failover Scheduled
For planned upgrades, or when operating a formation without high availability that experiences a failure, this event will appear to indicate a future planned failover event.
- Formation name
- Formation url
- Leader
- Failover at
For planned failovers, “failover at” will usually match your maintenance window. Note that the failover might happen at this point or shortly thereafter, once a follower is available and has caught up to the primary database.
Failover
Failovers happen to address hardware failure, as mentioned, and also for other reasons such as performing system software upgrades, or transferring data to a server with better hardware.
- Formation name
- Formation url
- Leader
- Situation
- Follower
StatsD external reporting
Citus Cloud can send events to an external StatsD server for detailed monitoring. Citus Cloud sends the following statsd metrics:
| Metric | Notes |
|---|---|
| citus.disk.data.total | |
| citus.disk.data.used | |
| citus.load.1 | Load in past 1 minute |
| citus.load.5 | Load in past 5 minutes |
| citus.load.15 | Load in past 15 minutes |
| citus.locks.granted.<mode>.<locktype>.count | See below |
| citus.mem.available | |
| citus.mem.buffered | |
| citus.mem.cached | |
| citus.mem.commit_limit | Memory currently available to be allocated on the system |
| citus.mem.committed_as | Total amount of memory estimated to complete the workload |
| citus.mem.dirty | Amount of memory waiting to be written back to the disk |
| citus.mem.free | Amount of physical RAM left unused |
| citus.mem.total | Total amount of physical RAM |
| citus.pgbouncer_outbound.cl_active | Active client connections |
| citus.pgbouncer_outbound.cl_waiting | Waiting client connections |
| citus.pgbouncer_outbound.sv_active | Active server connections |
| citus.pgbouncer_outbound.sv_idle | Idle server connections |
| citus.pgbouncer_outbound.sv_used | Server connections idle more than server_check_delay |
| citus.postgres_connections.active | |
| citus.postgres_connections.idle | |
| citus.postgres_connections.unknown | |
| citus.postgres_connections.used |
Notes:
- The
citus.mem.*metrics are reported in kilobytes, and are also recorded in megabytes assystem.mem.*. Memory metrics come from/proc/meminfo, and the proc(5) man page contains a description of each. - The
citus.load.*metrics are duplicated assystem.load.*. citus.locks.granted.*andcitus.locks.not_granted.*usemodeandlocktypeas present in Postgres’ pg_locks table.- See the pgBouncer docs for more details about the pgbouncer_outbound metrics.
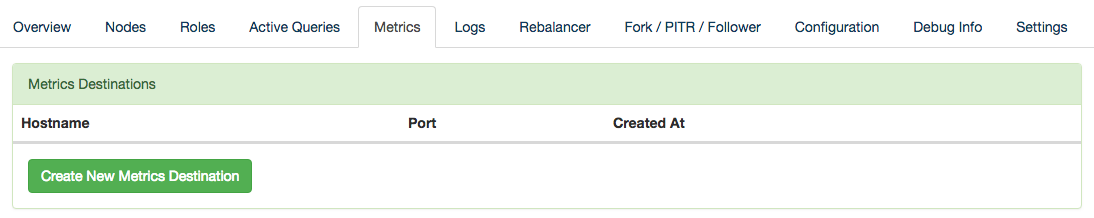
To send these metrics to a statsd server, use the “Create New Metrics Destination” button in the “Metrics” tab of Cloud Console.
Then fill in the host details in the resulting dialog box.
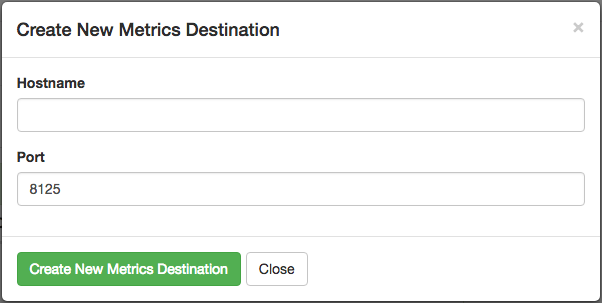
The statsd protocol is not encrypted, so we advise setting up VPC peering between the server and your Citus Cloud cluster.
Example: Datadog with statsd
Datadog is a product which receives application metrics in the statsd protocol and makes them available in a web interface with sophisticated queries and reports. Here are the steps to connect it to Citus Cloud.
Sign up for a Datadog account and take note of your personal API key. It is available at https://app.datadoghq.com/account/settings#api
Launch a Linux server, for instance on EC2.
In that server, install the Datadog Agent. This is a program which listens for statsd input and translates it into Datadog API requests. In the server command line, run:
# substitute your own API key
DD_API_KEY=1234567890 bash -c \
  "$(curl -L https://raw.githubusercontent.com/DataDog/datadog-agent/master/cmd/agent/install_script.sh)"
Configure the agent. (If needed, see Datadog per-platform guides)
cat - | sudo tee -a /etc/datadog-agent/datadog.yaml << CONF
non_local_traffic: yes
use_dogstatsd: yes
dogstatsd_port: 8125
dogstatsd_non_local_traffic: yes
log_level: info
log_file: /var/log/datadog/agent.log
CONF

# this is how to do it on ubuntu
sudo systemctl restart datadog-agent
Fill in the agent server information as a new metrics destination in the Cloud Console. See the previous section for details.
The agent should now appear in the Infrastructure section in Datadog.
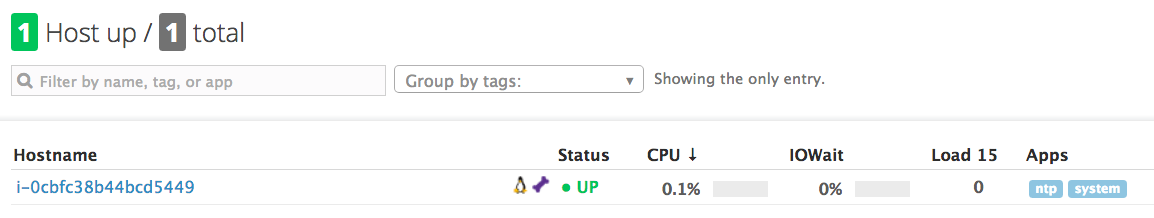
Clicking the hostname link goes into a full dashboard of all the metrics, with the ability to write queries and set alerts.
Systemic Cloud Status
Any events affecting the Citus Cloud platform as a whole are recorded on status.citusdata.com.