Query Processing
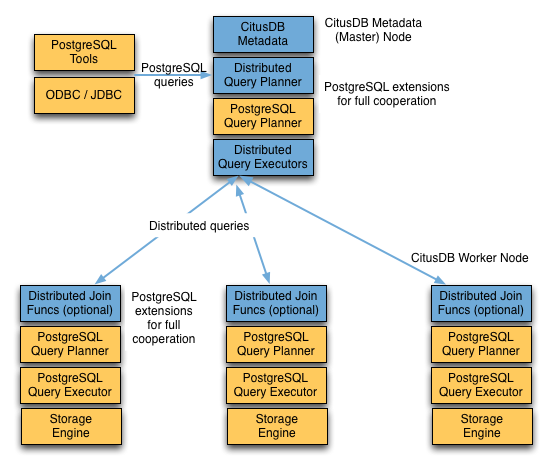
A Citus cluster consists of a coordinator instance and multiple worker instances. The data is sharded and replicated on the workers while the coordinator stores metadata about these shards. All queries issued to the cluster are executed via the coordinator. The coordinator partitions the query into smaller query fragments where each query fragment can be run independently on a shard. The coordinator then assigns the query fragments to workers, oversees their execution, merges their results, and returns the final result to the user. The query processing architecture can be described in brief by the diagram below.
Citus’s query processing pipeline involves the two components:
- Distributed Query Planner and Executor
- PostgreSQL Planner and Executor
We discuss them in greater detail in the subsequent sections.
Distributed Query Planner
Citus’s distributed query planner takes in a SQL query and plans it for distributed execution.
For SELECT queries, the planner first creates a plan tree of the input query and transforms it into its commutative and associative form so it can be parallelized. It also applies several optimizations to ensure that the queries are executed in a scalable manner, and that network I/O is minimized.
Next, the planner breaks the query into two parts - the coordinator query which runs on the coordinator and the worker query fragments which run on individual shards on the workers. The planner then assigns these query fragments to the workers such that all their resources are used efficiently. After this step, the distributed query plan is passed on to the distributed executor for execution.
The planning process for key-value lookups on the distribution column or modification queries is slightly different as they hit exactly one shard. Once the planner receives an incoming query, it needs to decide the correct shard to which the query should be routed. To do this, it extracts the distribution column in the incoming row and looks up the metadata to determine the right shard for the query. Then, the planner rewrites the SQL of that command to reference the shard table instead of the original table. This re-written plan is then passed to the distributed executor.
Distributed Query Executor
Citus’s distributed executors run distributed query plans and handle failures that occur during query execution. The executors connect to the workers, send the assigned tasks to them and oversee their execution. If the executor cannot assign a task to the designated worker or if a task execution fails, then the executor dynamically re-assigns the task to replicas on other workers. The executor processes only the failed query sub-tree, and not the entire query while handling failures.
Citus has three basic executor types: real time, router, and task tracker. It chooses which to use dynamically, depending on the structure of each query, and can use more than one at once for a single query, assigning different executors to different subqueries/CTEs as needed to support the SQL functionality. This process is recursive: if Citus cannot determine how to run a subquery then it examines sub-subqueries.
At a high level, the real-time executor is useful for handling simple key-value lookups and INSERT, UPDATE, and DELETE queries. The task tracker is better suited for larger SELECT queries, and the router executor for access data that is co-located in a single worker node.
The choice of executor for each query can be displayed by running PostgreSQL’s EXPLAIN command. This can be useful for debugging performance issues.
Real-time Executor
The real-time executor is the default executor used by Citus. It is well suited for getting fast responses to queries involving filters, aggregations and co-located joins. The real time executor opens one connection per shard to the workers and sends all fragment queries to them. It then fetches the results from each fragment query, merges them, and gives the final results back to the user.
Since the real time executor maintains an open connection for each shard to which it sends queries, it may reach file descriptor / connection limits while dealing with high shard counts. In such cases, the real-time executor throttles on assigning more tasks to workers to avoid overwhelming them with too many tasks. One can typically increase the file descriptor limit on modern operating systems to avoid throttling, and change Citus configuration to use the real-time executor. But, that may not be ideal for efficient resource management while running complex queries. For queries that touch thousands of shards or require large table joins, you can use the task tracker executor.
Furthermore, when the real time executor detects simple INSERT, UPDATE or DELETE queries it assigns the incoming query to the worker which has the target shard. The query is then handled by the worker PostgreSQL server and the results are returned back to the user. In case a modification fails on a shard replica, the executor marks the corresponding shard replica as invalid in order to maintain data consistency.
Router Executor
When all data required for a query is stored on a single node, Citus can route the entire query to the node and run it there. The result set is then relayed through the coordinator node back to the client. The router executor takes care of this type of execution.
Although Citus supports a large percentage of SQL functionality even for cross-node queries, the advantage of router execution is 100% SQL coverage. Queries executing inside a node are run in a full-featured PostgreSQL worker instance. The disadvantage of router execution is the reduced parallelism of executing a query using only one computer.
Task Tracker Executor
The task tracker executor is well suited for long running, complex data warehousing queries. This executor opens only one connection per worker, and assigns all fragment queries to a task tracker daemon on the worker. The task tracker daemon then regularly schedules new tasks and sees through their completion. The executor on the coordinator regularly checks with these task trackers to see if their tasks completed.
Each task tracker daemon on the workers also makes sure to execute at most citus.max_running_tasks_per_node concurrently. This concurrency limit helps in avoiding disk I/O contention when queries are not served from memory. The task tracker executor is designed to efficiently handle complex queries which require repartitioning and shuffling intermediate data among workers.
Subquery/CTE Push-Pull Execution
If necessary Citus can gather results from subqueries and CTEs into the coordinator node and then push them back across workers for use by an outer query. This allows Citus to support a greater variety of SQL constructs, and even mix executor types between a query and its subqueries.
For example, having subqueries in a WHERE clause sometimes cannot execute inline at the same time as the main query, but must be done separately. Suppose a web analytics application maintains a visits table partitioned by page_id. To query the number of visitor sessions on the top twenty most visited pages, we can use a subquery to find the list of pages, then an outer query to count the sessions.
SELECT page_id, count(distinct session_id)
FROM visits
WHERE page_id IN (
  SELECT page_id
  FROM visits
  GROUP BY page_id
  ORDER BY count(*) DESC
  LIMIT 20
)
GROUP BY page_id;
The real-time executor would like to run a fragment of this query against each shard by page_id, counting distinct session_ids, and combining the results on the coordinator. However the LIMIT in the subquery means the subquery cannot be executed as part of the fragment. By recursively planning the query Citus can run the subquery separately, push the results to all workers, run the main fragment query, and pull the results back to the coordinator. The “push-pull” design supports a subqueries like the one above.
Let’s see this in action by reviewing the EXPLAIN output for this query. It’s fairly involved:
GroupAggregate  (cost=0.00..0.00 rows=0 width=0)
  Group Key: remote_scan.page_id
  ->  Sort  (cost=0.00..0.00 rows=0 width=0)
    Sort Key: remote_scan.page_id
    ->  Custom Scan (Citus Real-Time)  (cost=0.00..0.00 rows=0 width=0)
      ->  Distributed Subplan 6_1
        ->  Limit  (cost=0.00..0.00 rows=0 width=0)
          ->  Sort  (cost=0.00..0.00 rows=0 width=0)
            Sort Key: COALESCE((pg_catalog.sum((COALESCE((pg_catalog.sum(remote_scan.worker_column_2))::bigint, '0'::bigint))))::bigint, '0'::bigint) DESC
            ->  HashAggregate  (cost=0.00..0.00 rows=0 width=0)
              Group Key: remote_scan.page_id
              ->  Custom Scan (Citus Real-Time)  (cost=0.00..0.00 rows=0 width=0)
                Task Count: 32
                Tasks Shown: One of 32
                ->  Task
                  Node: host=localhost port=5433 dbname=postgres
                  ->  Limit  (cost=1883.00..1883.05 rows=20 width=12)
                    ->  Sort  (cost=1883.00..1965.54 rows=33017 width=12)
                      Sort Key: (count(*)) DESC
                      ->  HashAggregate  (cost=674.25..1004.42 rows=33017 width=12)
                        Group Key: page_id
                        ->  Seq Scan on visits_102264 visits  (cost=0.00..509.17 rows=33017 width=4)
      Task Count: 32
      Tasks Shown: One of 32
      ->  Task
        Node: host=localhost port=5433 dbname=postgres
        ->  HashAggregate  (cost=734.53..899.61 rows=16508 width=8)
          Group Key: visits.page_id, visits.session_id
          ->  Hash Join  (cost=17.00..651.99 rows=16508 width=8)
            Hash Cond: (visits.page_id = intermediate_result.page_id)
            ->  Seq Scan on visits_102264 visits  (cost=0.00..509.17 rows=33017 width=8)
            ->  Hash  (cost=14.50..14.50 rows=200 width=4)
              ->  HashAggregate  (cost=12.50..14.50 rows=200 width=4)
                Group Key: intermediate_result.page_id
                ->  Function Scan on read_intermediate_result intermediate_result  (cost=0.00..10.00 rows=1000 width=4)
Let’s break it apart and examine each piece.
GroupAggregate  (cost=0.00..0.00 rows=0 width=0)
  Group Key: remote_scan.page_id
  ->  Sort  (cost=0.00..0.00 rows=0 width=0)
    Sort Key: remote_scan.page_id
The root of the tree is what the coordinator node does with the results from the workers. In this case it is grouping them, and GroupAggregate requires they be sorted first.
    ->  Custom Scan (Citus Real-Time)  (cost=0.00..0.00 rows=0 width=0)
      ->  Distributed Subplan 6_1
.
The custom scan has two large sub-trees, starting with a “distributed subplan.”
        ->  Limit  (cost=0.00..0.00 rows=0 width=0)
          ->  Sort  (cost=0.00..0.00 rows=0 width=0)
            Sort Key: COALESCE((pg_catalog.sum((COALESCE((pg_catalog.sum(remote_scan.worker_column_2))::bigint, '0'::bigint))))::bigint, '0'::bigint) DESC
            ->  HashAggregate  (cost=0.00..0.00 rows=0 width=0)
              Group Key: remote_scan.page_id
              ->  Custom Scan (Citus Real-Time)  (cost=0.00..0.00 rows=0 width=0)
                Task Count: 32
                Tasks Shown: One of 32
                ->  Task
                  Node: host=localhost port=5433 dbname=postgres
                  ->  Limit  (cost=1883.00..1883.05 rows=20 width=12)
                    ->  Sort  (cost=1883.00..1965.54 rows=33017 width=12)
                      Sort Key: (count(*)) DESC
                      ->  HashAggregate  (cost=674.25..1004.42 rows=33017 width=12)
                        Group Key: page_id
                        ->  Seq Scan on visits_102264 visits  (cost=0.00..509.17 rows=33017 width=4)
.
Worker nodes run the above for each of the thirty-two shards (Citus is choosing one representative for display). We can recognize all the pieces of the IN (…) subquery: the sorting, grouping and limiting. When all workers have completed this query, they send their output back to the coordinator which puts it together as “intermediate results.”
      Task Count: 32
      Tasks Shown: One of 32
      ->  Task
        Node: host=localhost port=5433 dbname=postgres
        ->  HashAggregate  (cost=734.53..899.61 rows=16508 width=8)
          Group Key: visits.page_id, visits.session_id
          ->  Hash Join  (cost=17.00..651.99 rows=16508 width=8)
            Hash Cond: (visits.page_id = intermediate_result.page_id)
.
Citus starts another real-time job in this second subtree. It’s going to count distinct sessions in visits. It uses a JOIN to connect with the intermediate results. The intermediate results will help it restrict to the top twenty pages.
            ->  Seq Scan on visits_102264 visits  (cost=0.00..509.17 rows=33017 width=8)
            ->  Hash  (cost=14.50..14.50 rows=200 width=4)
              ->  HashAggregate  (cost=12.50..14.50 rows=200 width=4)
                Group Key: intermediate_result.page_id
                ->  Function Scan on read_intermediate_result intermediate_result  (cost=0.00..10.00 rows=1000 width=4)
.
The worker internally retrieves intermediate results using a read_intermediate_result function which loads data from a file that was copied in from the coordinator node.
This example showed how Citus executed the query in multiple steps with a distributed subplan, and how you can use EXPLAIN to learn about distributed query execution.
PostgreSQL planner and executor
Once the distributed executor sends the query fragments to the workers, they are processed like regular PostgreSQL queries. The PostgreSQL planner on that worker chooses the most optimal plan for executing that query locally on the corresponding shard table. The PostgreSQL executor then runs that query and returns the query results back to the distributed executor. You can learn more about the PostgreSQL planner and executor from the PostgreSQL manual. Finally, the distributed executor passes the results to the coordinator for final aggregation.