Note
We are no longer onboarding new users to Citus Cloud on AWS. However, existing customers can continue to use Citus Cloud as they do today.
Monitoring
Cloud Platform Status
Any events affecting the Citus Cloud platform as a whole are recorded on status.citusdata.com. This page shows a chart of recent uptime, as well as listing any past incidents.
Resources Usage
Citus Cloud metrics enable you to get information about your cluster’s health and performance. The “Metrics” tab of the Cloud Console provides graphs for a number of measurements, all viewable per node. Below are the metrics, broken into categories, with details about the less obvious ones.
Amazon EBS Volume Metrics
(A full description of the metrics reported by Citus Cloud for underlying EBS resources can be found in the AWS documentation about I/O Characteristics and Monitoring.)
IOPS are a unit of measure representing input/output operations per second. The operations are measured in KiB, and the underlying drive technology determines the maximum amount of data that a volume type counts as a single I/O.
Read IOPS
Write IOPS
Volume queue length is the number of pending I/O requests for a device. Latency is the true end-to-end client time of an I/O operation, in other words, the time elapsed between sending an I/O and receiving an acknowledgement that the I/O read or write is complete.
Average Queue Length (Count)
Average Read Latency (Seconds)
Average Write Latency (Seconds)
Bytes Read / Second
Bytes Written / Second
CPU and Network
CPU Utilization (Percent)
Network - Bytes In / Second
Network - Bytes Out / Second
PostgreSQL Write-Ahead Log
WAL Bytes Written / Second
Formation Events Feed
To monitor events in the life of a formation with outside tools via a standard format, we offer RSS feeds per organization. You can use a feed reader or RSS Slack integration (e.g. on an #ops channel) to keep up to date.
On the upper right of the “Formations” list in the Cloud console, follow the “Formation Events” link to the RSS feed.
The feed includes entries for three types of events, each with the following details:
Server Unavailable
This is a notification of connectivity problems such as hardware failure.
Formation name
Formation url
Server
Failover Scheduled
For planned upgrades, or when operating a formation without high availability that experiences a failure, this event will appear to indicate a future planned failover event.
Formation name
Formation url
Leader
Failover at
For planned failovers, “failover at” will usually match your maintenance window. Note that the failover might happen at this point or shortly thereafter, once a follower is available and has caught up to the primary database.
Failover
Failovers happen to address hardware failure, as mentioned, and also for other reasons such as performing system software upgrades, or transferring data to a server with better hardware.
Formation name
Formation url
Leader
Situation
Follower
Disk Almost Full
The “disk-almost-full” event happens if the disk utilization in the Postgres data directory reaches or exceeds 90%.
Formation name
Formation url
Server
“used_bytes”
“total_bytes”
“threshold_pct” (always 90)
The alert will appear once every twenty-four hours until the disk usage is resolved.
High CPU Utilization
The “cpu-utilization-high” event happens when there is CPU utilization reaches or exceeds 90%.
Formation name
Formation url
Server
“util_pct” (0-100% utilization value)
“threshold_pct” (always 90)
The alert will appear once per hour until CPU utilization goes down to a normal level.
StatsD external reporting
Citus Cloud can send events to an external StatsD server for detailed monitoring. Citus Cloud sends the following statsd metrics:
Metric |
Notes |
|---|---|
citus.disk.data.total |
|
citus.disk.data.used |
|
citus.load.1 |
Load in past 1 minute |
citus.load.5 |
Load in past 5 minutes |
citus.load.15 |
Load in past 15 minutes |
citus.locks.granted.<mode>.<locktype>.count |
See below |
citus.mem.available |
|
citus.mem.buffered |
|
citus.mem.cached |
|
citus.mem.commit_limit |
Memory currently available to be allocated on the system |
citus.mem.committed_as |
Total amount of memory estimated to complete the workload |
citus.mem.dirty |
Amount of memory waiting to be written back to the disk |
citus.mem.free |
Amount of physical RAM left unused |
citus.mem.total |
Total amount of physical RAM |
citus.pgbouncer_outbound.cl_active |
Active client connections |
citus.pgbouncer_outbound.cl_waiting |
Waiting client connections |
citus.pgbouncer_outbound.sv_active |
Active server connections |
citus.pgbouncer_outbound.sv_idle |
Idle server connections |
citus.pgbouncer_outbound.sv_used |
Server connections idle more than server_check_delay |
citus.postgres_connections.active |
|
citus.postgres_connections.idle |
|
citus.postgres_connections.unknown |
|
citus.postgres_connections.used |
Notes:
The
citus.mem.*metrics are reported in kilobytes, and are also recorded in megabytes assystem.mem.*. Memory metrics come from/proc/meminfo, and the proc(5) man page contains a description of each.The
citus.load.*metrics are duplicated assystem.load.*.citus.locks.granted.*andcitus.locks.not_granted.*usemodeandlocktypeas present in Postgres’ pg_locks table.See the pgBouncer docs for more details about the pgbouncer_outbound metrics.
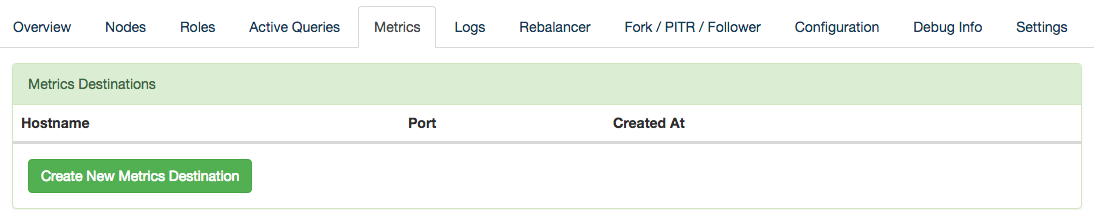
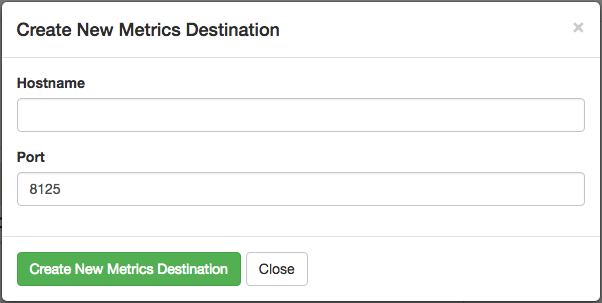
To send these metrics to a statsd server, use the “Create New Metrics Destination” button in the “Metrics” tab of Cloud Console.
Then fill in the host details in the resulting dialog box.
The statsd protocol is not encrypted, so we advise setting up VPC peering between the server and your Citus Cloud cluster.
Example: Datadog with statsd
Datadog is a product which receives application metrics in the statsd protocol and makes them available in a web interface with sophisticated queries and reports. Here are the steps to connect it to Citus Cloud.
Sign up for a Datadog account and take note of your personal API key. It is available at https://app.datadoghq.com/account/settings#api
Launch a Linux server, for instance on EC2.
In that server, install the Datadog Agent. This is a program which listens for statsd input and translates it into Datadog API requests. In the server command line, run:
# substitute your own API key
DD_API_KEY=1234567890 bash -c \
  "$(curl -L https://raw.githubusercontent.com/DataDog/datadog-agent/master/cmd/agent/install_script.sh)"
Configure the agent. (If needed, see Datadog per-platform guides)
cat - | sudo tee -a /etc/datadog-agent/datadog.yaml << CONF
non_local_traffic: yes
use_dogstatsd: yes
dogstatsd_port: 8125
dogstatsd_non_local_traffic: yes
log_level: info
log_file: /var/log/datadog/agent.log
CONF

# this is how to do it on ubuntu
sudo systemctl restart datadog-agent
Fill in the agent server information as a new metrics destination in the Cloud Console. See the previous section for details.
The agent should now appear in the Infrastructure section in Datadog.
Clicking the hostname link goes into a full dashboard of all the metrics, with the ability to write queries and set alerts.
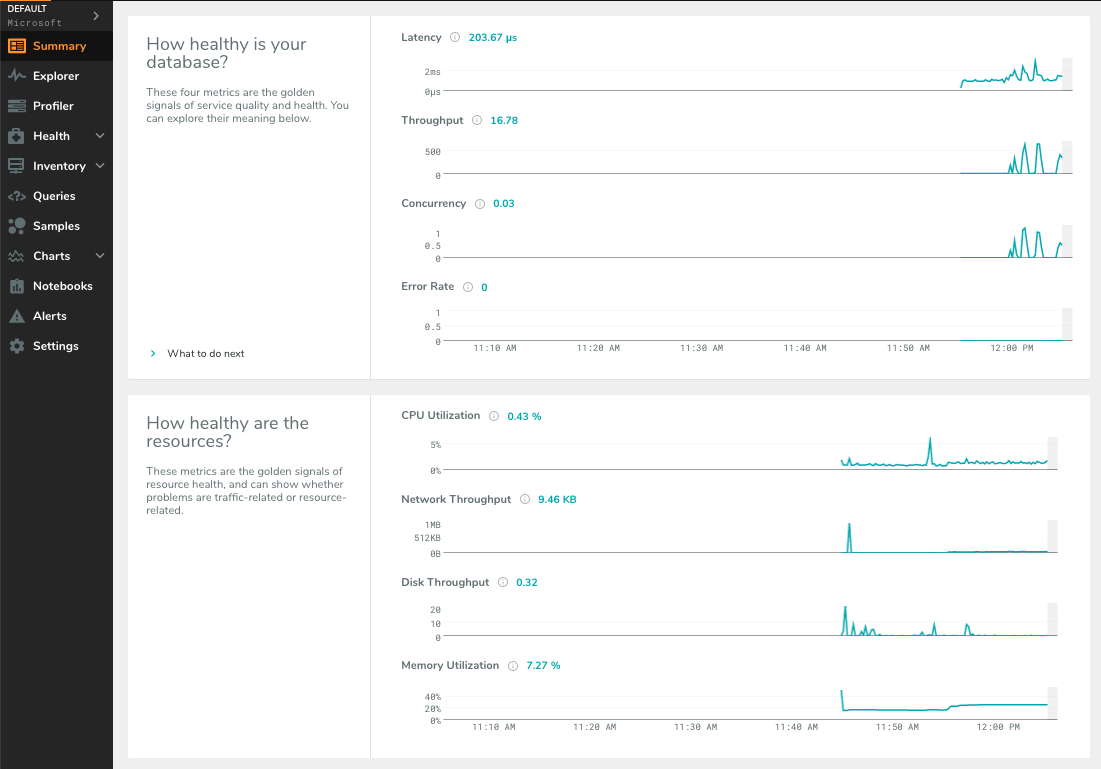
VividCortex External Monitoring
Like the systems above, VividCortex provides a metrics dashboard. While the other systems mostly focus on computer resources, VividCortex focuses on the performance of queries. It tracks their throughput, error rate, 99th percentile latency, and concurrency.
To integrate VividCortex with Citus Cloud we’ll be using the Off-Host Configuration. In this mode we choose a database role with permissions to read the PostgreSQL statistics tables, and give the role’s login information to the VividCortex agent. VividCortex then connects and periodically collects information.
Here’s a step-by-step guide to get started.
Note
The steps below give VividCortex access to the database as the “citus” role. This role has fairly elevated permissions. Consider possible issues of data confidentiality before enabling VividCortex monitoring.
Create a special VividCortex schema and relations on the Citus coordinator node.
# Use their SQL script to create schema and
# helper functions to monitor the cluster

curl -L https://docs.vividcortex.com/create-stat-functions-v96.sql | \
  psql [connection_uri]
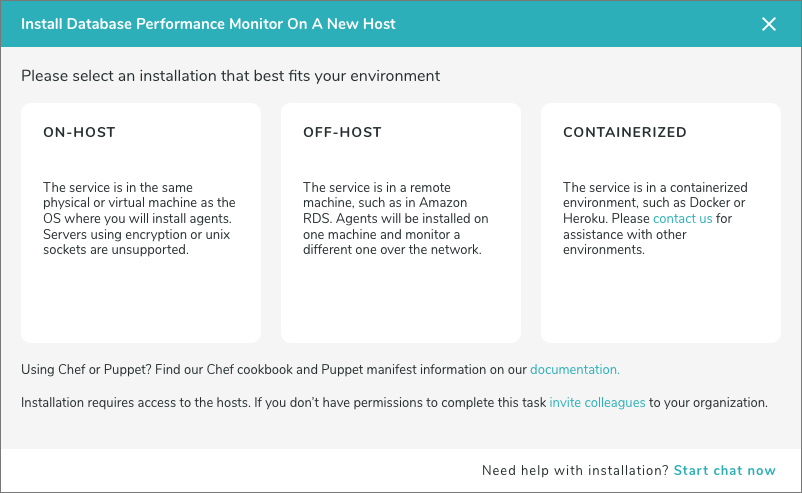
Create a VividCortex account.
The Summary page will prompt you to “Install Database Performance Monitor On A New Host.” Choose OFF-HOST.
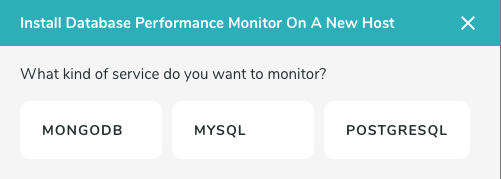
Select the PostgreSQL database.
Input the connection information into the credentials screen in the VividCortex wizard. The “citus” user is required. Make sure SSL Enabled is on, and that you’re using SSL Mode “Verify Full.” Specify
/etc/ssl/certs/citus.crtfor the SSL Authority.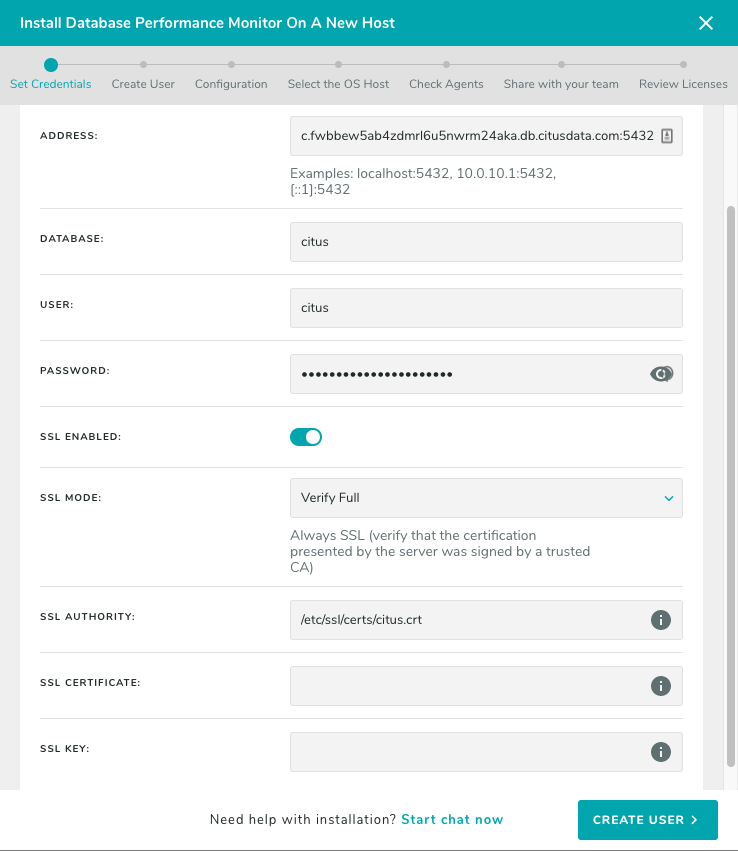
Skip the create user step. We’ll be using the “citus” user, because it’s the only one with enough permissions to view query statistics on Citus Cloud.
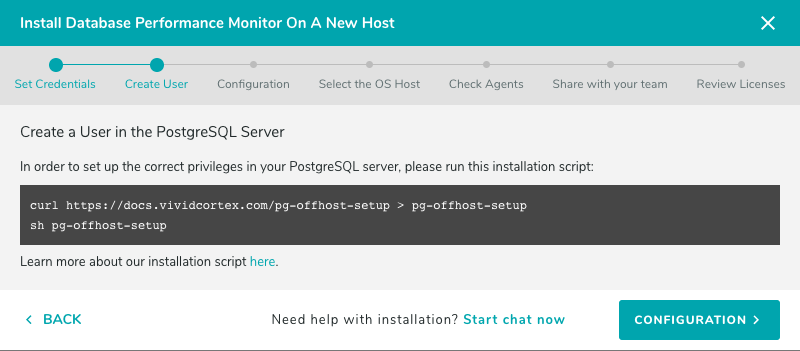
(Skip this step)
Skip the configuration step. We know that
pg_stat_statementsis pre-configured properly on Citus Cloud.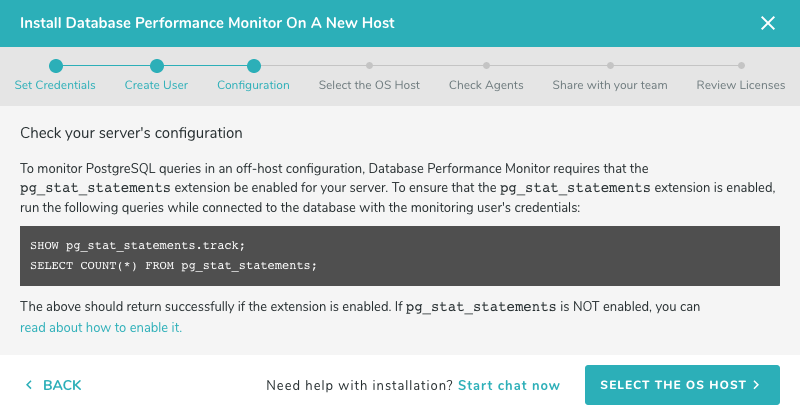
(Skip this step)
Provision a server to act as the VividCortex agent. For instance a small EC2 instance will do. On this new host install the Citus Cloud SSL certificate.
sudo curl -L https://console.citusdata.com/citus.crt \
  -o /etc/ssl/certs/citus.crt
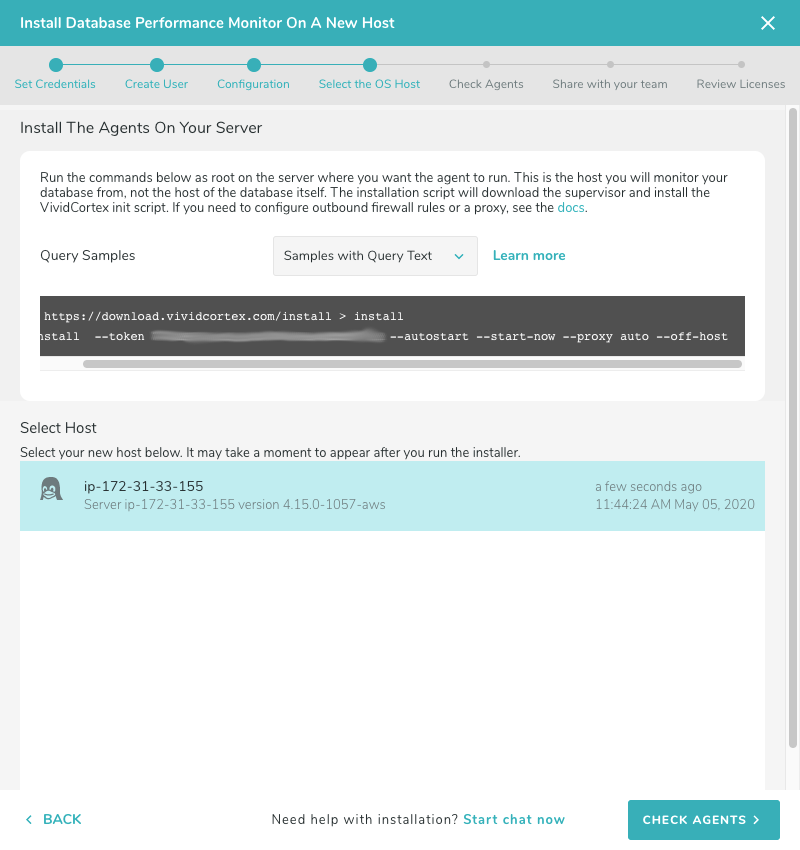
Advance to the next screen in the wizard. It will contain commands to run on the agent server, customized with a token for your account.
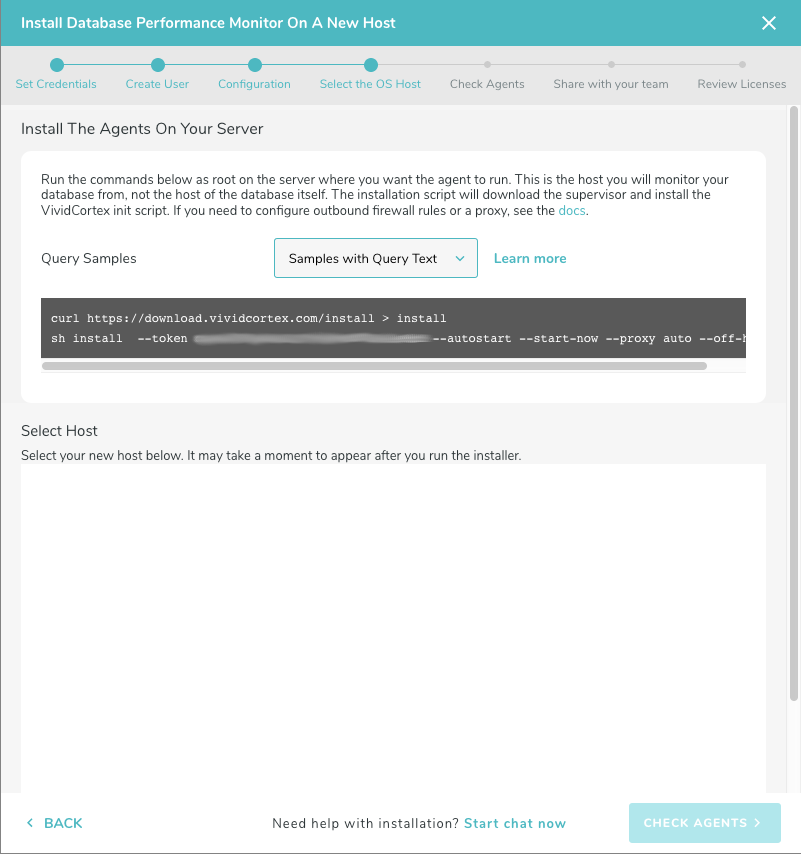
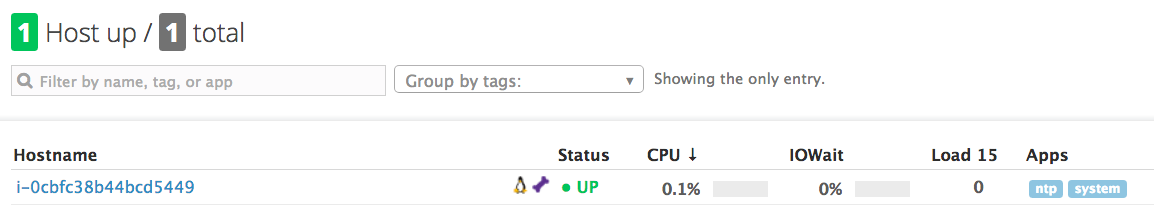
After running the commands on your server, the server will appear under Select host. Click it and go to the next step in the wizard.
After these steps, VividCortex should show all systems as activated.
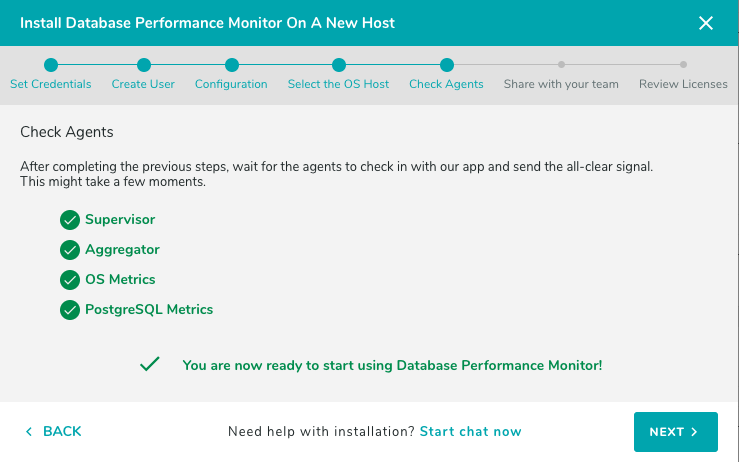
You can then proceed to the dashboard to monitor queries on your Citus cluster.