Real-Time Dashboards
Citus provides real-time queries over large datasets. One workload we commonly see at Citus involves powering real-time dashboards of event data.
For example, you could be a cloud services provider helping other businesses monitor their HTTP traffic. Every time one of your clients receives an HTTP request your service receives a log record. You want to ingest all those records and create an HTTP analytics dashboard which gives your clients insights such as the number HTTP errors their sites served. It’s important that this data shows up with as little latency as possible so your clients can fix problems with their sites. It’s also important for the dashboard to show graphs of historical trends.
Alternatively, maybe you’re building an advertising network and want to show clients clickthrough rates on their campaigns. In this example latency is also critical, raw data volume is also high, and both historical and live data are important.
In this section we’ll demonstrate how to build part of the first example, but this architecture would work equally well for the second and many other use-cases.
Data Model
The data we’re dealing with is an immutable stream of log data. We’ll insert directly into Citus but it’s also common for this data to first be routed through something like Kafka. Doing so has the usual advantages, and makes it easier to pre-aggregate the data once data volumes become unmanageably high.
We’ll use a simple schema for ingesting HTTP event data. This schema serves as an example to demonstrate the overall architecture; a real system might use additional columns.
-- this is run on the coordinator

CREATE TABLE http_request (
  site_id INT,
  ingest_time TIMESTAMPTZ DEFAULT now(),

  url TEXT,
  request_country TEXT,
  ip_address TEXT,

  status_code INT,
  response_time_msec INT
);

SELECT create_distributed_table('http_request', 'site_id');
When we call create_distributed_table
we ask Citus to hash-distribute http_request using the site_id column. That means
all the data for a particular site will live in the same shard.
The UDF uses the default configuration values for shard count. We recommend using 2-4x as many shards as CPU cores in your cluster. Using this many shards lets you rebalance data across your cluster after adding new worker nodes.
Note
Azure Database for PostgreSQL — Hyperscale (Citus) uses streaming replication to achieve high availability and thus maintaining shard replicas would be redundant. In any production environment where streaming replication is unavailable, you should set citus.shard_replication_factor to 2 or higher for fault tolerance.
With this, the system is ready to accept data and serve queries! Keep the following loop running in a psql console in the background while you continue with the other commands in this article. It generates fake data every second or two.
DO $$
  BEGIN LOOP
    INSERT INTO http_request (
      site_id, ingest_time, url, request_country,
      ip_address, status_code, response_time_msec
    ) VALUES (
      trunc(random()*32), clock_timestamp(),
      concat('http://example.com/', md5(random()::text)),
      ('{China,India,USA,Indonesia}'::text[])[ceil(random()*4)],
      concat(
        trunc(random()*250 + 2), '.',
        trunc(random()*250 + 2), '.',
        trunc(random()*250 + 2), '.',
        trunc(random()*250 + 2)
      )::inet,
      ('{200,404}'::int[])[ceil(random()*2)],
      5+trunc(random()*150)
    );
    COMMIT;
    PERFORM pg_sleep(random() * 0.25);
  END LOOP;
END $$;
Once you’re ingesting data, you can run dashboard queries such as:
SELECT
  site_id,
  date_trunc('minute', ingest_time) as minute,
  COUNT(1) AS request_count,
  SUM(CASE WHEN (status_code between 200 and 299) THEN 1 ELSE 0 END) as success_count,
  SUM(CASE WHEN (status_code between 200 and 299) THEN 0 ELSE 1 END) as error_count,
  SUM(response_time_msec) / COUNT(1) AS average_response_time_msec
FROM http_request
WHERE date_trunc('minute', ingest_time) > now() - '5 minutes'::interval
GROUP BY site_id, minute
ORDER BY minute ASC;
The setup described above works, but has two drawbacks:
Your HTTP analytics dashboard must go over each row every time it needs to generate a graph. For example, if your clients are interested in trends over the past year, your queries will aggregate every row for the past year from scratch.
Your storage costs will grow proportionally with the ingest rate and the length of the queryable history. In practice, you may want to keep raw events for a shorter period of time (one month) and look at historical graphs over a longer time period (years).
Rollups
You can overcome both drawbacks by rolling up the raw data into a pre-aggregated form. Here, we’ll aggregate the raw data into a table which stores summaries of 1-minute intervals. In a production system, you would probably also want something like 1-hour and 1-day intervals, these each correspond to zoom-levels in the dashboard. When the user wants request times for the last month the dashboard can simply read and chart the values for each of the last 30 days.
CREATE TABLE http_request_1min (
  site_id INT,
  ingest_time TIMESTAMPTZ, -- which minute this row represents

  error_count INT,
  success_count INT,
  request_count INT,
  average_response_time_msec INT,
  CHECK (request_count = error_count + success_count),
  CHECK (ingest_time = date_trunc('minute', ingest_time))
);

SELECT create_distributed_table('http_request_1min', 'site_id');

CREATE INDEX http_request_1min_idx ON http_request_1min (site_id, ingest_time);
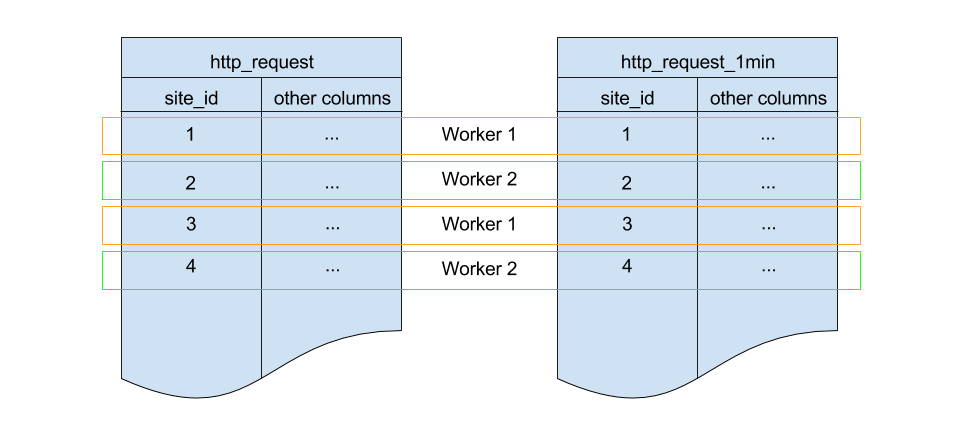
This looks a lot like the previous code block. Most importantly: It also shards on
site_id and uses the same default configuration for shard count and
replication factor. Because all three of those match, there’s a 1-to-1
correspondence between http_request shards and http_request_1min shards,
and Citus will place matching shards on the same worker. This is called
co-location; it makes queries such as joins faster and our rollups possible.
In order to populate http_request_1min we’re going to periodically run
an INSERT INTO SELECT. This is possible because the tables are co-located.
The following function wraps the rollup query up for convenience.
-- single-row table to store when we rolled up last
CREATE TABLE latest_rollup (
  minute timestamptz PRIMARY KEY,

  -- "minute" should be no more precise than a minute
  CHECK (minute = date_trunc('minute', minute))
);

-- initialize to a time long ago
INSERT INTO latest_rollup VALUES ('10-10-1901');

-- function to do the rollup
CREATE OR REPLACE FUNCTION rollup_http_request() RETURNS void AS $$
DECLARE
  curr_rollup_time timestamptz := date_trunc('minute', now());
  last_rollup_time timestamptz := minute from latest_rollup;
BEGIN
  INSERT INTO http_request_1min (
    site_id, ingest_time, request_count,
    success_count, error_count, average_response_time_msec
  ) SELECT
    site_id,
    date_trunc('minute', ingest_time),
    COUNT(1) as request_count,
    SUM(CASE WHEN (status_code between 200 and 299) THEN 1 ELSE 0 END) as success_count,
    SUM(CASE WHEN (status_code between 200 and 299) THEN 0 ELSE 1 END) as error_count,
    SUM(response_time_msec) / COUNT(1) AS average_response_time_msec
  FROM http_request
  -- roll up only data new since last_rollup_time
  WHERE date_trunc('minute', ingest_time) <@
          tstzrange(last_rollup_time, curr_rollup_time, '(]')
  GROUP BY 1, 2;

  -- update the value in latest_rollup so that next time we run the
  -- rollup it will operate on data newer than curr_rollup_time
  UPDATE latest_rollup SET minute = curr_rollup_time;
END;
$$ LANGUAGE plpgsql;
Note
The above function should be called every minute. You could do this by adding a crontab entry on the coordinator node:
* * * * * psql -c 'SELECT rollup_http_request();'
Alternatively, an extension such as pg_cron allows you to schedule recurring queries directly from the database.
The dashboard query from earlier is now a lot nicer:
SELECT site_id, ingest_time as minute, request_count,
       success_count, error_count, average_response_time_msec
  FROM http_request_1min
 WHERE ingest_time > date_trunc('minute', now()) - '5 minutes'::interval;
Expiring Old Data
The rollups make queries faster, but we still need to expire old data to avoid unbounded storage costs. Simply decide how long you’d like to keep data for each granularity, and use standard queries to delete expired data. In the following example, we decided to keep raw data for one day, and per-minute aggregations for one month:
DELETE FROM http_request WHERE ingest_time < now() - interval '1 day';
DELETE FROM http_request_1min WHERE ingest_time < now() - interval '1 month';
In production you could wrap these queries in a function and call it every minute in a cron job.
Data expiration can go even faster by using table range partitioning on top of Citus hash distribution. See the Timeseries Data section for a detailed example.
Those are the basics! We provided an architecture that ingests HTTP events and then rolls up these events into their pre-aggregated form. This way, you can both store raw events and also power your analytical dashboards with subsecond queries.
The next sections extend upon the basic architecture and show you how to resolve questions which often appear.
Approximate Distinct Counts
A common question in HTTP analytics deals with approximate distinct counts: How many unique visitors visited your site over the last month? Answering this question exactly requires storing the list of all previously-seen visitors in the rollup tables, a prohibitively large amount of data. However, an approximate answer is much more manageable.
A datatype called hyperloglog, or HLL, can answer the query approximately; it takes a surprisingly small amount of space to tell you approximately how many unique elements are in a set. Its accuracy can be adjusted. We’ll use ones which, using only 1280 bytes, will be able to count up to tens of billions of unique visitors with at most 2.2% error.
An equivalent problem appears if you want to run a global query, such as the number of unique IP addresses which visited any of your client’s sites over the last month. Without HLLs this query involves shipping lists of IP addresses from the workers to the coordinator for it to deduplicate. That’s both a lot of network traffic and a lot of computation. By using HLLs you can greatly improve query speed.
First you must install the HLL extension; the github repo has instructions. Next, you have to enable it:
CREATE EXTENSION hll;
Note
This is not necessary on Hyperscale, which has HLL already installed, along with other useful extensions.
Now we’re ready to track IP addresses in our rollup with HLL. First add a column to the rollup table.
ALTER TABLE http_request_1min ADD COLUMN distinct_ip_addresses hll;
Next use our custom aggregation to populate the column. Just add it to the query in our rollup function:
@@ -1,10 +1,12 @@
  INSERT INTO http_request_1min (
    site_id, ingest_time, request_count,
    success_count, error_count, average_response_time_msec
+   , distinct_ip_addresses
  ) SELECT
    site_id,
    minute,
    COUNT(1) as request_count,
    SUM(CASE WHEN (status_code between 200 and 299) THEN 1 ELSE 0 END) as success_count,
    SUM(CASE WHEN (status_code between 200 and 299) THEN 0 ELSE 1 END) as error_count,
    SUM(response_time_msec) / COUNT(1) AS average_response_time_msec
+   , hll_add_agg(hll_hash_text(ip_address)) AS distinct_ip_addresses
  FROM http_request
Dashboard queries are a little more complicated, you have to read out the distinct
number of IP addresses by calling the hll_cardinality function:
SELECT site_id, ingest_time as minute, request_count,
       success_count, error_count, average_response_time_msec,
       hll_cardinality(distinct_ip_addresses) AS distinct_ip_address_count
  FROM http_request_1min
 WHERE ingest_time > date_trunc('minute', now()) - interval '5 minutes';
HLLs aren’t just faster, they let you do things you couldn’t previously. Say we did our rollups, but instead of using HLLs we saved the exact unique counts. This works fine, but you can’t answer queries such as “how many distinct sessions were there during this one-week period in the past we’ve thrown away the raw data for?”.
With HLLs, this is easy. You can compute distinct IP counts over a time period with the following query:
SELECT hll_cardinality(hll_union_agg(distinct_ip_addresses))
FROM http_request_1min
WHERE ingest_time > date_trunc('minute', now()) - '5 minutes'::interval;
You can find more information on HLLs in the project’s GitHub repository.
Unstructured Data with JSONB
Citus works well with Postgres’ built-in support for unstructured data types. To demonstrate this, let’s keep track of the number of visitors which came from each country. Using a semi-structure data type saves you from needing to add a column for every individual country and ending up with rows that have hundreds of sparsely filled columns. We have a blog post explaining which format to use for your semi-structured data. The post recommends JSONB, here we’ll demonstrate how to incorporate JSONB columns into your data model.
First, add the new column to our rollup table:
ALTER TABLE http_request_1min ADD COLUMN country_counters JSONB;
Next, include it in the rollups by modifying the rollup function:
@@ -1,14 +1,19 @@
  INSERT INTO http_request_1min (
    site_id, ingest_time, request_count,
    success_count, error_count, average_response_time_msec
+   , country_counters
  ) SELECT
    site_id,
    minute,
    COUNT(1) as request_count,
    SUM(CASE WHEN (status_code between 200 and 299) THEN 1 ELSE 0 END) as success_count
    SUM(CASE WHEN (status_code between 200 and 299) THEN 0 ELSE 1 END) as error_count
    SUM(response_time_msec) / COUNT(1) AS average_response_time_msec
- FROM http_request
+   , jsonb_object_agg(request_country, country_count) AS country_counters
+ FROM (
+   SELECT *,
+     count(1) OVER (
+       PARTITION BY site_id, date_trunc('minute', ingest_time), request_country
+     ) AS country_count
+   FROM http_request
+ ) h
Now, if you want to get the number of requests which came from America in your dashboard, you can modify the dashboard query to look like this:
SELECT
  request_count, success_count, error_count, average_response_time_msec,
  COALESCE(country_counters->>'USA', '0')::int AS american_visitors
FROM http_request_1min
WHERE ingest_time > date_trunc('minute', now()) - '5 minutes'::interval;